See You Later, Thick Data – Part 3
This blogpost is part of the methodological series “See You Later, Thick Data – How we experimented with doing collaborative fieldwork as part of an interdisciplinary research project”. In this series, we, a group of anthropologically trained junior scholars, discuss some of the opportunities and challenges we faced when collecting ethnographic data in a week-long, interdisciplinary case study of the Danish democratic festival “The People’s Meeting”. We took on a somewhat different approach to the classic anthropological fieldwork, and in this series, we share our experiences with a highly preplanned, systematic, and collaborative way of collecting ethnographic data that is integrable with other data types.
Producing Comparable Data through Systematic Observation
It’s 7:45 am. The morning briefing is about to start as you shove in the last bites of breakfast. One from the team is looking for the right cable to connect a laptop to the television screen. In a moment, the screen will display slides of today’s observation guide. Last-minute instructions are hurled out in the room as the clock strikes 8:30, and it’s time to go. Short of breath from hurrying to your designated event tent, you place yourself strategically, mobile phone in hand and ready to intensively observe and note down. With one eye on the clock and another on the audience, you note down anything of relevance in front of you. You alternate between counting the phone-scrollers, stage-watchers, and conversationalists every 15th minute and jotting down observations in the Ethno-platform. Overwhelmed by the many impressions, you wonder if you are following the detailed instructions like you’re supposed to. But exactly what measures are necessary to align our data collection for our purpose and make our observations comparable between researchers?

Picture 3. Morning briefing
Each morning, we held a briefing to make sure all ethnographers were in on the observation guide of the day (Picture 4). This was to ensure that everyone entered the event tents with the same analytical filter. When you venture into the craft of ethnography, you quickly realize that a million things happen at the same time. You cannot note everything down and all field observations are in principle an exclusion of other events you could have documented. By explicating exactly what we had to observe, we hoped to install a collective lens, which would capture the same type of attention-related behavior across researchers. The guides also served as a helpful tool to keep each of us on track of what to take notice of.

Picture 4. Example of observation guide
Quantified Attention-related Behavior
We figured that one way of streamlining our fieldnotes would be by counting attention-related behavior among the audience at different events. This idea of explicitly counting occurrences in the field is not very common in social anthropology where there seems to be a reluctancy to “mathematize” the discipline. However, some scholars hold that anthropologists do in fact count all the time in the sense that they register recurrences in the field to detect prevalent dynamics and themes. However, they rarely state the exact number of times a particular event happens. For our data collection at The People’s Meeting, we decided to deviate from traditional modes of doing fieldwork by explicitly quantifying ethnographic observations. This was done by developing what we call attention schemes and seating charts for the different event stages. The attention schemes and seating charts were distributed to each ethnographer alongside the observation guides at the morning briefing. Examples of these are shown in Picture 5 below.
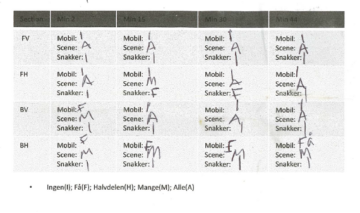

Picture 5. Example of filled out observation scheme and seating chart
With the seating chart (Picture 5, right), we could spatially map where the audience were sitting at each event. In the example above, the ethnographer marked people present at the time that the event started with a black dot, and people arriving later with a ring. The attention schemes (Picture 5, left) were used to map attention behavior during the events. With the event tent divided into four sections (front-right, front-left, back-right, back-left), we noted if none (I), few (F), half (H), many (M), or everyone (A) were looking at the stage, at their phones, or talking to each other. We registered this in the attention schemes every 15 minutes.
Ensuring Comparability
Aside from the schemes and charts, we observed what took place in front of us in between the 15-minute intervals and wrote descriptive fieldnotes in the Ethno-platform. These tasks demanded our undivided attention if we were to uphold rigor in our data collection. Indeed, we find that this combination of observation guides, schemes, and the common format for fieldnotes provided by the Ethno-platform provided us with data that work well in combination. What we got was detailed records of how a given event progressed and different measures of the audience’s attention. And since we repeated the same procedure at each observed event, we can align and compare the data and hereby confirm or dismiss different tendencies we’ve observed across events and ethnographers throughout the festival site.
During the People’s Meeting we ended up collecting a ton of fieldnotes, seating charts, and attention schemes, and when we returned to the university it was time to reach our final goal of this project, namely, to process and analyze the data computationally – but more on that in the following blogpost.
The authors if this blogpost series are Sofie Læbo Astrupgaard — PhD fellow in Social Data Science at the University of Copenhagen, Clara Rosa Sandbye — PhD fellow at the Department of Anthropology at Aarhus University, and Emilie Gregersen — MSc student in Social Data Science at the University of Copenhagen. The trio has been working as a part of the interdisciplinary research project DISTRACT, studying the dynamics of issue attention at a political festival.